Showing posts with label GIS. Show all posts

Wednesday, August 28, 2013

Summer School

My summer involved a full set of research courses, including Museums & Library Research at the Metropolitan Museum of Art, Researching Local Histories and the Summer Map Institute at NYPL. The workload was a bit heavy due to the fact that the MetMuseum course was not actually a two week course, as noted in the bulletin, but two weeks of seminar followed by a month of intensive research. Ultimately it was a great experience, working in three very different kinds of research: museum artifacts, local landmarks and maps.

NYC Garden Maps banner image
NYC Garden Maps, a WordPress site on community gardening in New York City

My map project on NYC Garden Maps is done. I am editing the final deliverables for presentation here, including a walking tour of the Bloomingdale neighborhood on the Upper West Side and a MetMuseum exhibition guide. Look for these shortly.

Also, I spent the summer with my linked data team refining our paper on "Linked Data for Cultural Institutions," which has been accepted to ACM's 2013 SIGDOC conference. This has been a challenging and extremely rewarding experience and I thank my teammates and co-authors, Julia Marden, Carolyn Li-Madeo and Jeff Edelstein of Pratt Institute. I celebrated the end of an intense summer with two weeks in the Massachusetts Berkshires.

Thursday, July 25, 2013

Map Literature Review

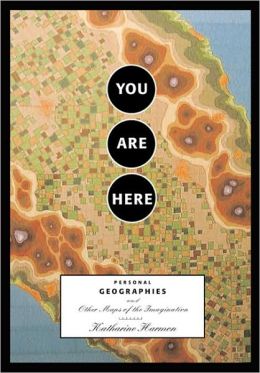
For this literature review I selected two sources, one practical and one fanciful. The practical source is “Digital Map Librarianship: A Working Syllabus” from the IFLA Section of Geography and Map Libraries. The fanciful one is You Are Here: Personal Geographies and other Maps of the Imagination by Katherine Harmon. I actually own a copy of Harmon's book and browse through it frequently.


“Digital Map Librarianship: A Working Syllabus,” IFLA Section of Geography and Map Libraries. Accessed July 24, 2013, http://magic.lib.uconn.edu/exhibits/ifla/.

“Digital Map Librarianship: A Working Syllabus” was prepared by the IFLA Section of Geography and Map Libraries to provide a framework for teaching librarians how to use digital cartographic materials and metadata, developing a collection website and preparing a reference guide. The materials are divided into sections, each of which contain detailed information about a series of subtopics and a suggested citation for further reading.

The “What is a digital map” section compares the function and features of paper versus digital maps and explains basic concepts of digital maps such as raster and vector data, primary and secondary sources, and features of the spatial database like scale, projection, symbols, spatial data quality that may be unique to digital information.

The “Working with geodata” section walks the reader through the process of accessing and downloading digital data from ESRI’s “Digital Chart of the World.” It also provides links to other digital data sources and the user guide for ArcExplorer. Unfortunately some of the links on the website are broken, including most of the external library references and the link to ArcExplorer. According to ESRI’s website, ArcExplorer has been superseded by ArcGIS Explorer, a newer version of the online software. In this case the page directs the user to the updated site.

The section on “Library functions” contains information on developing an online reference guide for users of the library’s digital collection with links to examples from a number of university libraries. It also links to building digital dataset and image collections, storage issues and processing paper collections for digitization.

The “Metadata” section provides an overview to metadata in general A link to the typology of metadata for cartographic and spatial data, including explanations of Band One through Four metadata and a useful chart identifying the purpose and formats for each level of metadata. For example, linking Band One to unstructured data, Band Two to Dublin Core/DTD, Band Three to ISBD/MARC/UNIMARC and Band Four to FGDC, CEN, ISO/Base DTD.

Evaluation

The currency of the information on this website is not optimal. There is no specific ”updated on” date information listed on the site. Clues to the age of the site include the home page, which links to “Past Workshops” dated 1996 and 1997, and section citations, which are primarily dated 1997. This suggests that the site is not maintained regularly, if at all, and accounts for the vast number of broken links. In some cases, such as the link to ArcExplorer, the target page provided a link to the updated page, but most of the library references returned an error page or resolved to the library home page. Oddens Bookmarks has been closed for a number of years. I looked at the IFLA website and found that the Section of Geography and Map Libraries no longer exists and there are no other divisions, sections, special interest groups or special programs on mapping or geography, so it is unlikely that this resource will be further updated.

Overall, this website has value as a historical document and perhaps practical value as a starting point for basic digital mapping concepts and for developing a map collection and reference materials for public use. However, there is surely more up to date information available through organizations, such as the ALA’s Map & Geospatial Information Round Table (http://www.ala.org/magirt/) or the Special Libraries Association’s Geography and Map Section (http://units.sla.org/division/dgm/).


Harmon, Katharine (ed.). You Are Here: Personal Geographies and Other Maps of the Imagination. New York, N.Y.: Princeton Architectural Press, 2004.

You Are Here: Personal Geographies and Other Maps of the Imagination, edited by Katherine Harmon is a selection of essays and full color map images created by writers, visual artists, poets, historians and map enthusiasts. I was interested in this book after having taken a unit on counter mapping in Professor Chris Sula’s Digital Humanities Course. The maps included in this volume are not maps in the sense that they represent a physical reality, but instead use the pictorial imagery of map making as a metaphor for concepts they are meant to depict.

Harmon discusses in the introduction the power that maps hold over our imaginations. She uses phrases like “terrain of imagination” and “contour lines of experience” to highlight how the coded, visual language of maps is an accessible metaphor for human expression. In pointing out the work of creative cartographers infusing maps with humor and the map maker’s particular point of view, she also underlines how even in maps that are intended to represent a physical reality are themselves skewed by the cartographer’s political, religious, or personal objectives.

This volume includes six essays and a number of poems and excerpts from literature, such as passages Lewis Carroll’s The Hunting of the Shark and Roald Dahl’s The BFG, which serve as bookends to the work. I particularly liked Lewis Carroll’s chart of the ocean from The Hunting of the Shark that pictures nothing, but is described as a map “we all could understand.”

The essays include Stephen S. Hall’s memoir of his own introduction to and love of maps and Bridget Booher’s account of a lifetime of bodily injury, represented as a kind of walking tour of her life. Roger Sheffer’s “The Mental Geography of Appalachian Trail Hikers” includes map-like drawings, doodles, instructions and detours that hikers left in guest books at trail shelters along the route. Hugh Brogan discusses the lure of maps in illustrating imaginary places in children’s literature.

Katie Davis’ “Memory Map” describes the old trope about people giving directions to strangers based on where things used to be, such as “…turn left where the big tree used to be before the earthquake,” and explains the urge people have to describe places in personal terms. I connected with this story through the research I am doing on the history of places and what used to be there.

Harmon writes that our attraction to maps is instinctive, that even if a map is of a place we’ve never been or that doesn’t even exist, we understand the image and know what to do with it. The images in this volume are particularly compelling, almost making the essays secondary.  These include memory maps, maps from fictional locations, maps of the human body, and maps that chart behaviors that lead one to heaven or hell or help one find love. Some of the maps are completely imaginary or use familiar shapes, such as hearts or country outlines to walk the viewer through a representation of an idea. Others use existing and familiar maps, such as the London Underground, as a framework for making an explicit statement about data layered on it.

Evaluation

You Are Here is an engaging look at how people use maps creatively to express ideas, opinions or to illustrate imaginary places and themes. It reveals the psychology of maps and spatial representation as a form of expression. As a map library resource, this book would be useful in exploring the choices made in iconography and representation of space. It would be particularly helpful to historians studying antiquarian maps, as some of these, while attempting to document a spatial reality, contain exaggerated or imagined boundaries, fanciful imagery and iconography of political expression. It would also find a place in arts and visual design libraries, literature libraries, as well as social and political science libraries.

Thursday, July 18, 2013

Findings Report: Web Map Resources

The following is a Findings Report on web map resources that I completed as part of a study of NYC Community Gardens for Pratt's Map Institute at the New York Public Library Map Division taught by Matt Knutzen. I reviewed the Library of Congress Geography and Map Reading Room website, GeoCommons and OASISNYC as potential resources for completing this project.


Library of Congress Geography and Map Reading Room
http://www.loc.gov/rr/geogmap/

The Library of Congress Geography and Map Reading Room website contains information about visiting and using the institution’s physical and digital library resources. Major sections of the website include information about the history and background of the Map Division, reference services, digital collections, acquisitions and the Philip Lee Phillips Society friends of the library group.

The center of the page offers links to a featured Map of the Peninsula of Florida by Joan Vinkeboons labeled with the date “[1639?].” Clicking the map opens it in the Division’s map viewer. There are two additional links that open the “new map interface” and an older “American Memory format” which appears to be from a 1999 website design, based on the style and copyright date for many of the materials. The information in the right column contains library hours, “Ask a Librarian” online request form and a current, featured map project, “Places in History: 150th Anniversary of the U.S. Civil War (2011-2115).”

The links were a bit confusing at first since I had expected the label, “Geography & Map Division Map Collections using a new interface,” would link to a press release or a guide to the new interface. Instead it leads directly to the main page of a catalog tool for digital holdings. Unless you start from the general catalog search, most of the linked materials on the Map Division Website retrieve the older, American Memory interface.

The American Memory format link leads to the American Memory project. The interface retains the look and feel of late 1990s web development; however it does contain a useful, browsable subject and title index as well as search. The “Places in History” links also link to the older American Memory interface if you click the map itself. If you click the “more” or “learn more” links you can retrieve more detailed information in a modern interface, including links to the catalog records for cited maps, the KML file in some cases, and a link for ordering reproductions.

The American Memory interface allows you to zoom into smaller portions of a map via JPEG2000 images at various resolutions and zoom levels. The modern interface is the Library of Congress’ general catalog search filtered to the map collection. This includes a search bar with Maps selected and search results showing a summary of listings, including catalog information. Facets allow you to filter by original format, online format, date, collection, contributor, subject, location and language. This integrates the Map collection with the larger LOC catalog, providing access and discovery. An addition to this search page that is unique to the Map Division is tabs labeled “Search Maps” and “Map Collection” which offer the ability to search or browse the collection. Detailed information about the Map Viewers is another useful page included in the Digital Collections section.

From the standpoint of a researcher seeking to utilize the collection, the links on the left column of the home page describing reference policies, guides to the collection, finding aids and a link to the Online Map Collection are most useful. Reference policies describe how one can gain access to the collection and services available including how to obtain a Reader Identification Card, how to make inquiries from a distance and the kinds of copying services available, including reminders about appropriate citation and copyright permissions.

Finding aids and collection guides appear to be similar concepts, though the finding aids, of which there are only three, are EAD encoded resources, while the collection guides list a larger number of topics with web pages hosting brief descriptions and essays. A few, such as the American Women project, are multipage, curated websites. The collection guides are not uniform in layout. Some point to materials in the old American Memory format, while others are displayed in the new format that is browsable by Title, Subject, Audio, Photograph, Drawing, Video, and Written Narrative.

While I expected the NYPL would have more materials that are relevant to my research in community gardens, I wanted to look at the Library of Congress site particularly as a complement to the NYPL resources. I did find an interesting aerial mosaic of the neighborhood where my garden is located from 1929, showing some buildings that are still there and others that have since been demolished or replaced. It is interesting to see that certain surrounding features in nearby Central Park and the relative widths of major versus minor streets are still the same today as they were at the time the photographs were taken, though the paving is clearly of a different quality. Unfortunately, some of the detail is difficult to discern.


GeoCommons
http://geocommons.com/

GeoCommons is a public community website of ESRI GeoIQ users, who according to the website, "are building an open repository of data and maps for the world." The GeoIQ platform includes a features for uploading, accessing, visualizing and analyzing data. Some of these features include the ability to create and share custom maps with layered data and animations through time and space. The platform allows you to upload your own data, and it will create statistics that you can analyze and download in many formats, including CSV, KML, ESRI Shapefile, JSON and Atom. Additionally, site viewers can search for and access your map, filter the data, copy it to their own accounts so they can add or modify the data and share the results.

GeoCommons serves as an introduction to ESRI's GeoIQ enterprise edition which contains more powerful predictive analytics tools, integration with social media and the ability to keep data private and to manage access and workflow. Data can be stored in the cloud or hosted on a virtual machine. GeoIQ Connect can integrate with Oracle, MySQL, PostgreSQL, ESRI, MongoDB, and other datastores and APIs. Also, a free developers kit allows you to create custom applications that integrate with GeoIQ.

Reviewing GeoCommons from the perspective of a community garden organizer, it seems that the free version would be sufficient for most uses. Gardens could be plotted on a map and compared to surrounding land uses and current and proposed planning and construction projects. Individual gardens might like to use GeoCommons to create plot maps of members’ beds. My local community garden recently installed a beehive, so it would be an interesting project to plot areas where bees are found in the garden.

Most community gardens are not large enough or rich enough to purchase an enterprise edition; however, if it were purchased by the City Parks Department, it could conceivably be used to host and manage users who are affiliated with the department's Operation Green Thumb gardening program. Advocacy groups might like to use it to promote development of gardens in areas of greatest need. For example, the NYC Parks Department website indicates that many community gardens have historically been created in areas where access to open public spaces is limited. An existing NYC community garden map on the GeoCommons site shows a concentration of gardens in the Lower East Side and East Harlem in Manhattan and Bedford-Stuyvesant and East New York in Brooklyn.

As a research and reference tool GeoCommons is limited to the datasets that have been uploaded by site users. ESRI offers a search tool for discovery and showcases featured maps, but there is no formal index and the community of maps run the gamut from formal studies to test runs, such as the one I created to play with a community garden map that I found. As a tool for teaching basic GIS skills, the site is quite useful. It is very easy to upload data and play with the basemap and icons, and the download formats offer a way to work easily with spreadsheet views or Google Earth.


OASIS
http://www.oasisnyc.net/map.aspx

OASIS map focuses in open space in New York City. It is maintained by the Center for Urban Research at CUNY Graduate Center.  It was one of the first maps created specifically to address the low ratio of open space per citizen. It is an excellent research tool for highlighting open space and comparing to surrounding land uses.

OASIS is a collaborative project between CUNY and a number of data providers including the US. Army Corps of Engineers, the Wildlife Conservation Foundation, the Stewardship Mapping Project, the USDA Forest Service, the Manahatta Project and the Council on the Environment of NYC’s community gardens program. The diversity of partners, most of whom contributed data to analyze specific problems, is a testament to the various use cases and array of visualizations possible with this tool. The platform that OASIS runs on is ESRI ArcGIS Server with OpenLayers open source map viewing library and Javascript web framework, JS Ext.

In addition to open space and land use data, OASIS includes data layers showing transit lines, such as roads, subways, bus lines and bike routes; environmental data such as coastal storm impact zones, Forever Wild sites, and public access waterfronts; environmental impact zones, such as brownfields, hazardous waste treatment centers and volunteer cleanup sites; social services such as schools, libraries, and NYCHA and subsidized housing properties; as well as zoning, population characteristics, water and wetland areas, political boundaries and historical datasets.

It is possible to overlay data onto historical aerial photography from 1996 to 2008 via a slider interface. Also, because the map is linked to the Manhatta project, you can display recreated aerial landscapes from 1609 and overlay it with data from that period, including wildlife habitats, Lenape Indian trails, eco-community data and shorelines. Additional historic overlays include Montresor map from 1775, the Poppleton map from 1817, the Viele map from 1874, and the Bromley Atlas from 1911 (all maps from New York Public Library).

It is a powerful discovery tool. If you select a property on the map, the Location Report tab offers detailed information about the property, including tax block and lot information, owner, property dimensions, like building area, number of units and whether commercial space is included, political and community district information and other relevant information. It also has direct links to the property’s Zoning Map, NYC Dept. of Buildings and transaction records, tax assessment, the  Digital Tax Map, NYC zoning guide and NYC Watershed Resources.

OASIS is a good website for garden organizers. In fact, the community gardens project was one of the earliest projects that ran on OASIS. It lists community garden search as one of the main features on the homepage, along with special searches for stewardship organizations, such as block associations and historical societies. It functions well as a directory for these kinds of community organizations since the metadata may include contact information, website address, hours, membership and other pertinent information about the entity in addition to property information such as ownership, block and lot number and political jurisdiction.

Tuesday, January 29, 2013

Digital Humanities and Archaeology

Presentation to Digital Humanities class at Pratt Institute, covering the history of computing in the field of archaeology and current digital humanities projects.


Friday, November 30, 2012

Archiving Digital Maps

An excerpt and presentation from an academic paper on archiving digital maps:


I have been a member of the Geographic Information System (“GIS”) community in New York City, since the early 1990s when I was a real estate researcher at Price Waterhouse. In those days, except for certain Federal departments, like the US Census, geographic data was largely held by the institutions that created it. Datasets were static, finite and, until the advent of DVDs and the World Wide Web, difficult to share, due to their often massive file size and the slow speed of internet file transfer. The sharing that did happen was informal, occasional, and often blocked, inadvertently or deliberately, by agency policy or licensing terms that restrict third party distribution. Census data and commercial products, such as demographics tables from Sales & Marketing Magazine, were available at the New York Public Library on tape, microfilm and later on DVD, but more proprietary data sources were often obtained through expensive licensing agreements or barter and a network of “who you know.” The GIS user group, GISMO, formed in 1990, was one place where such sharing occurred.

GISMO was originally created as a software user network where GIS professionals shared information on GIS tools and applications and presented projects at informal bi-monthly meetings. At the time that GISMO was formed, NYC agency geographers were frustrated with the lack of centrality of geographic data at the City level. There was no common base map of New York City on which to overlay geospatial data and no City library where geospatial resources were archived and available for extensive employee use. To address this problem, GISMO offered the following data advocacy statement:


GISMO supports freer access to data through interaction between NYC area GIS users as well as the following long range initiatives:
  • Developing common electronic base maps for GIS users in NYC.
  • Facilitating the data distribution among city agencies and between the public and
    private sector.
  • Coordinating local information systems for synergy, economy, and accuracy.
  • Providing GIS resources to technologically isolated organizations.

In this paper, I will take a look at the access issues that led a group of geographers to work toward developing a centralized data repository for New York City and how these efforts were mirrored and extended at the national level. While I learned a lot about GIS metadata and software, I will focus more on policy issues around the management of geographic data collections and then discuss archiving management issues more generally. I will avoid delving deeply into political themes around data access and control, though they do have a role in the history of geographic data and how public release and archival decisions are made. I will present information on early data clearinghouses and website archives which provided examples for more robust archival programs at local and national institutions, including NYPL, the Library of Congress, Data.Gov and the NYC Open Data initiative. I will also look at the cost of data, economic limitations on access and the promise of open data.

Full paper (.DOC 145.9kb)


Monday, July 23, 2012

GeoSprocket Live Survey on GIS Tools


The first round of results of a recent GIS user poll from GeoSprocket, asking about GIS tool used and frequency of use, are available:

Bill Morris surveyed GIS users via several feeds including a Vermont GIS listserv, ESRI and O'Reilly conference hashtags and the author's social media accounts. An interesting survey, but difficult to get a good read on who the sample represents. Not knowing how many people follow a specific Twitter hashtag, it is difficult to measure how many of the respondents might have found the survey via the ESRI versus the O'Reilly hashtag.

With those caveats, let's look at the numbers.

In the first release, 55% of the respondents are primary ESRI users, 24% use open source GIS tools, 16% are Google Map users and 8% use some other tool, including FME, MicroStation, ENVI/IDL, GIS Cloud, AutoDesk, Maptitude, Idrisi, Mapserver, Geocortex and others. Bill noted surprise at how many Google users there are. Frankly, I would have thought there would be more, but perhaps Bill's social network skews toward ESRI or that more people follow the ESRI hashtag than the O'Reilly one.

Overlap in product use is what I find most interesting about this survey.  It seems a larger proportion of people who use non-ESRI tools like Google Maps or open source products also use ESRI tools (80% versus 40%). However, 75% of ESRI users also use Google Maps. This  indicates that there is value for a lot of people in using a mixed approach.

The second round of Bill's survey remains open and live results indicate that there are indeed more Google users than the first round suggested. As of today, ESRI users remain the majority with 48% of users versus 30% Google Maps. The other categories are relatively the same.

It will be interesting to see how these numbers change as more people enter the survey.

It would also be more interesting and indeed useful to see why certain tools are used over others as opposed to simply which tools were used. Clearly with up to 80% overlap of use there must be reasons why certain tools are chosen for certain tasks. Hopefully, Bill will add that question in a subsequent survey.

Tuesday, May 29, 2012

The Information Architecture of Emergency Response

Now that I have been accepted into the Pratt Institute Masters of Library and Information Science program, I have started a journey to document the convergence between two of my favorite disciplines, Geographic Information Systems and Information Architecture. In the past few months, I've noticed an explosion of conferences and meetups addressing the geolocational aspects of digital applications for the web and especially mobile. I am a member of 16 different Meetup groups, eight of which address some aspect of the User Experience umbrella, four of which specialize in mapping and/or GIS, two somewhat general technology groups and two more that approach these disciplines from the fascinating perspectives of digital semiotics and data visualization and infographics. Each have hosted topics on user experience and location based design at some point. Many maddeningly scheduled for the same evening.

Commiserating with some of my colleagues with whom I helped create the NYC GeoSymposium 2001-2011-2021 back in November, we have found that in each of our practices, cartographers, GIS specialists and those working with visualizing location based information are finding a great need for design assistance. This seems natural, if somewhat belated and perhaps even surprising. Think of some of the most beautifully designed images and one must of course reflect on the maps of National Geographic magazine, those gorgeous squares of folded paper that come in every issue. Certainly, there is a longstanding sensibility around the design of useful and pleasing maps. Increasingly, these maps are in our hands on tablets and smart phones, so optimizing the display of information that used to be represented in enormous, rolled or folded pieces of paper is a challenge for our community.

Let's Talk About Maps

So I am doing my part in continuing this discussion of the place for design in online mapping. In March, I presented a talk in New Orleans at the 2012 IA Summit on The Information Architecture of Emergency Response. The presentation explored the evolution of technology in emergency response, with a special focus on advances in geographic systems, incident management, social media and policy in New York City since September 11, 2001. In it, I cover questions like:

  • What technologies do emergency responders in NYC use?
  • How have events like 9/11 and other incidents influenced technology advances?
  • What effect, if any, has the change from a Law Enforcement Mayor to a Media Mayor had on data policy?
  • What are the challenges and opportunities of open government data?
  • How is social media being used in NYC and elsewhere to engage the public in emergency preparedness and response?
  • And, finally, are app contests and hackathons an effective way to improve public services in difficult economic times?

I reprised the presentation, modified somewhat for an emergency responder audience for the Office of Emergency Management's annual Women's History Month Breakfast, where I had the pleasure of sharing the stage with Dr. Irene Osborne of Mount Sinai Hospital, who treated patients' internal injuries during the Haiti earthquake, and IA Institute founder and Development Manager, Bev Corwin, who presented on language translation in crisis situations, in particular a handheld Creole language translation device that she developed with colleagues at Carnegie Mellon University.

Continuing the Discussion

I have been asked to present another redux of Information Architecture of Emergency Response at the IxDA NYC's July meetup. I hope to conclude the IxDA with a Town Hall discussion of how the IA community can support emergency response efforts throughout each of our own neighborhoods. I ran out of time in New Orleans and would like to get a good conversation going with the UX community on issues and ideas for further exploration. My daughter's 6th grade graduation is June 7, so I will be missing the IxDA meeting that focuses on the Social Lives of Maps, with UX designer Ray Cha and Green Map's Thomas Turnbull. But I understand the GIS community will have someone there. If you attend, please introduce yourself to Jack Eichenbaum, who founded GISMO, a 20+ year old, NYC-based GIS user group. In the meantime, stay tuned for RSVP information for the July event.

It may also be interesting for my UX friends to hear (as I've heard through the grapevine) that ESRI, leader in GIS software, is developing an internal UX practice and should be hiring soon.

Slide decks of my IA of Emergency Response talks are now available at Slideshare:

March 23:
March 28:

Tuesday, January 24, 2012

Towards a 9/11 GeoArchive

Imagine if the most graphic and expressive artifacts from one of the most historic events in New York City lay rolled in tubes in a dusty corner. What if millions of bytes of geographic data, produced through an unprecedented, community collaboration, were dispersed, disconnected and hidden from public view? If you had the opportunity to preserve them, how would you do it?

During the September 11, 2001 rescue and recovery operations, I volunteered to help recruit geographers through a NYC-based GIS user group, called GISMO. The need was critical and overwhelming. The Mayor's Office of Emergency Management had been evacuated and no longer had access to maps and data necessary for the rescue effort, and if that wasn’t bad enough, they lacked the number of skilled hands to produce the hundreds of maps per day required by the unprecedented event. At this point, GISMO had been working for years to advocate for data sharing and cooperation among city, state, non-profit and private entities, and developed into a 400 strong social network. Hundreds of volunteers, many from GISMO, stepped forward. This effort served as a highly regarded, if anomalous, model for unified response in years to come. But the artifacts from this effort have not been preserved in any curatorial sense. I'd like to change that.

I recently participated in the NYC GeoSymposium 2001-2011-2021, which took a look at the advances and challenges of Geographic Information Systems in emergency response since 2001. Around this time I had been thinking very hard about my career goals and ways to combine my past experience in research and design with the grassroots efforts of the geographic community. I had been working with colleagues at GISMO for many years to draw attention to the important role geographers played in the 9/11 rescue and recovery. The GeoSymposium was a great experience, because it intended not just to honor those who participated in these efforts, but also to highlight the need to preserve the thousands of maps that tell the story.

My own contribution to the GeoSymposium was to explore the legacy of these efforts by examining the technological improvements at the Office of Emergency Management in the context of emergency events that had occurred since 2001. I was looking for a way to present time-based information in a map format and also to start a conversation with attendees about the history of emergency response technology and the importance of the preservation of geographic artifacts. My project contained a map of New York City with events plotted and color-coded by discrete periods, characterized by a common group of new technologies. An online version of the map is available at ArgGIS Explorer Online.

Map Detail Slides

The map highlights how the events surrounding 9/11 prompted improvements in incident management technology. Attendees, including the keynote presenter and eminent information designer, Edward Tufte, gathered around to discuss their experience with the events I had mapped and to offer advice on ways to enrich its design. (Some of Mr. Tufte’s comments led to further improvements which you can see via the links above.)

Simply talking about how to improve the map was an exercise in exploring history and memory: how people understand what happened, how events are related to one another, how what you choose to include and what not to include can influence a person’s understanding of the events, how the description of one event can bring to mind another similar one, etc. It was thrilling to observe the spontaneous conversation that started all because of a three by four foot piece of foamboard.

And that’s just one artifact. In the aftermath of 9/11, hundreds of maps were produced – Every Day – for months. The 9/11 geographic effort represented a level of cooperation not seen before or since, but whose legacy, coupled with improvements in technology platforms themselves, informs the open data initiatives we are now seeing throughout the U.S.

Of course, the artifacts of the 9/11 response have historical value by themselves. And that is where the images of dusty, neglected rolls of paper come in (even though most of the maps are on disks and hard drives). Several of my GISMO colleagues and I are exploring a plan to create a 9/11 Geographic Archive, featuring the maps that were produced during the rescue and recovery effort. I plan to present an outline of the 9/11 Geographic Archive and my map of emergency response technologies at the ASIS&T Information Architecture Summit in March 2012. Such an archive would be an important contribution to the history of emergency response in this country.

I have always loved presenting information in meaningful and digestible ways, whether through maps, market research reports, drawings, websites or online resource libraries and intranets. From very early in my career, I have been driven to present information in a coherent way and to seek out tools and processes that make coming to understanding easier. I am thrilled by the convergence that today's state of technology allows between geographic tools and the digital storytelling of the user experience discipline. What is really great about this project is that I will be able to combine aspects of two fields that I love into an end product that would have meaning for many now and in years to come.

So, if you had the opportunity to preserve artifacts from an important event in New York City history, how would you do it? Some of the groundwork has already begun. I have been working with a mentor to explore relationships with organizations that support technology projects in the digital humanities, and with museums and libraries that share an interest in geographic artifacts and 9/11. I am building on my relationships with the City’s amazing geographic community through GISMO, the thirty Geosymposium presenters who told the 9/11 story and senior staff at the Office of Emergency Management and other consultants who have expressed interest in an archive. (I have even applied to an information science program where I hope to explore this project further). Finally and perhaps most importantly, I have the support of members of the GISMO Steering Committee to pursue further resources and trainings to develop the framework for an archive entity. With that grounding, I can turn the question "How would you do it?" into "When can I start?"

Thursday, December 22, 2011

9/11 Geosymposium at Technology in Government 2011, New York

The NYC GeoSymposium: 2001-2011-2021 held on November 16, 2011 marked the tenth anniversary of the September 11th attacks by examining the response of the NYC GIS community regarding mobilization of geospatial resources after the event, evolution of procedures, data and technologies since the event, and exploring unmet needs for improved emergency planning and response, as well as future challenges posed by emerging social media and enterprise-wide deployment of software and hardware advances that underpin geospatial application development. I worked with several of my colleagues at GISMO to produce this event, which was co-located with NYC GovTech 2011. We will be launching a GIS design challenge in Spring or Summer 2012. Stay tuned.

Thursday, August 11, 2011

This Roadmap Could Use a GPS

I just finished reading Roadmap for the Digital City: Achieving New York City's Digital Future (PDF 2.17MB). A glaring economic concern struck me, which the report acknowledges but does not address adequately, despite devoting several pages to it, and that is the issue of access by underserved populations.

Solutions offered by the plan include noble goals. Free wireless access in parks, training and services in public libraries, senior centers and public housing facilities, a pilot project to bring computing into the homes and schools of 18,000 sixth grade students. These programs directly address the cost of access and a disparity of technology learning in our community. I don't want to discount these efforts, but do wish point out that the issue of access of the disadvantaged goes well beyond free wireless access.
It is disheartening to learn in the NY Times today that "free" Wi-Fi means, "The Wi-Fi in the parks would be free to all users for up to three 10-minute periods per month. Beyond that, users would pay 99 cents for each 24-hour period in which they log on." The Times reports that, "It would be free to all subscribers to the broadband services of Cablevision or Time Warner," which may include public housing where these services are available. In fact, the free Wi-Fi deal was a condition for renewing the cable franchise with the City. I would be interested in learning how many public housing residents are broadband subscribers with these services.

Here is another example: I have been providing computer training to an acquaintance who is a senior citizen and retired bookkeeper. She lives alone, is seeking employment, has worked with computers extensively in the past, but is about 15 years behind on the latest accounting technologies. She has a netbook with internet access but no mobile phone. For her, an iPhone app is useless and Twitter is bewildering (though she does like Facebook). Nothing really works the way she expects it to, including NYC.gov.

A large part of the Digital Roadmap involves community engagement through initiatives like PlaNYC’s Change By Us and the NYC Big Apps contest. Change By Us is a map-based website to collect thoughts from citizens about how to make New York City more livable. The NYC Big Apps Contest, an application development contest, sponsored by BMW, that invites developers to utilize open data collections from the City to address citizen needs, has indeed been a highly successful and exciting initiative raising awareness of engineering talent in NYC among the VC community and the technology industry at large. Keep in mind however, that it required an internet access to submit ideas to Change By Us and the Big Apps contest. So the citizenry making the requests are already connected.

The Digital Roadmap report notes challenges including staffing constraints and complicated legacy systems, and plans to a large degree to let its open government platform allow the developer community to create apps to address citizen needs, which they hope would be more cost effective than creating the services themselves. This crowdsourcing is indeed an effective way to get rapid development of products that the population actually wants and I am a big fan of the NYC Big Apps Contest. But while the Roadmap notes concern that the economically disadvantaged may not have access to the iPhones and Android technology that most of the Big Apps winners develop for, it's the flashier apps that have the most appeal among those that are tuned into the contest.

There are competing needs at stake here. On one hand are the VC funders who want to earn money on apps that serve a deep pocketed consumer market and the developers who want to wow potential funders and employers with their mastery of the latest programs for the coolest toys. On the other are the City's poor, senior citizens and those with developmental needs for which these toys may not be affordable, accessible or easy to use. The city is counting on corporate contract terms and good-hearted hackers to address citizen needs.

I understand that the City is forced to look to outside developers to serve these needs because tax revenue is so low. The strategy to open data and let developers come up with apps is a great way to provide services on a large scale, but not the best way to serve the needs of the underserved. And cutting inadequate deals with providers is more a way to say "We did it," than to say "We did it right." There needs to be an incentive for building apps for economically disadvantaged groups.

This all sounds very dreary. I should note that I am excited to see the level of engagement and openness in city government. After participating for 20 years in grass roots efforts to create an open discussion and sharing of public data, via my involvement with GISMO and the Municipal Arts Society's Community Information Technology Initiative, it's a step in the right direction.

But we can do more. And I’m working on an idea for involving my own develper community (IA, UX, GIS, etc) in coming up with a plan. If you are interested, please let me know.

Thursday, July 14, 2011

Open Government Forum at Internet Week NYC

Over the next couple of days I am going to post summaries of Internet Week sessions that I attended last month. Here is the first, a panel on open government in NYC:

In June, I attended a panel on Open Goverment in NYC, hosted by Time Warner as part of Internet Week NYC. I joined my friend, Queens Community Board 3 member, Tom Lowenhaupt, who has been advocating for a .NYC top level domain for over ten years. Given some of the road blocks he has faced in his campaign, I knew attending an Open Government forum with him would be interesting.

Presented in a panel format, the event focused on Setting the Digital Standard for open government. NYC Deputy Mayor for Operations Stephen Goldsmith introduced Jesse Hempel, a senior writer for Fortune Magazine, who moderated a panel of experts in government information technology including:

  • Adam Sharp, CEO, Twitter
  • Carol Post, Commissioner, NYC Department of Information Technology and Telecommunications (DoITT)
  • Rachel Sterne, Chief Digital Officer, NYC
  • Seth Pinsky, President, NYC Economic Development Corporation

Commissioner Post opened with a brief description of the city's plans for a digital roadmap, including a range of web 2.0 tools that allows the City to to communicate and join with citizens to make a better city, break through hardened boundaries between people, neighborhoods, agencies, etc. "The fundamental responsibility of government being to allow access to information," she said.

Tuesday, July 12, 2011

I Joined Google+ Today

I appear to be a late joiner to Google+, if the list of people in my contact's circles are any indication. It appears to have pulled my info from LinkedIn and has features of Facebook and a very interesting what if discussion among designers going on. I expect it will be a similar experience to LinkedIn and Facebook, perhaps with less of the silliness of Facebook but with similar features, such as Circles which lets you categorize people into groups. 

Just like Facebook, only better.

I've always liked that Facebook lets you group people. It's so natural. I tend to get frustrated by LinkedIn's degrees of separation - you are either in someone's network or you have someone or a chain of people between you and the other person. In a way this is nice because you are still able to contact people in your second network while preserving how you know that person (so and so's friend). Without a grouping feature, once you accept a person to your network on LinkedIn, you lose information about how you are connected to your new contact, unless you go to their page to see shared contacts.

Circles makes Google+ more personal and organized than LinkedIn. It is also more spare, sort of like the defunct Facebook Lite, but I'm witholding judgement for now. Facebook ended up dropping its Lite feature, and I suspect Google will eventually add in Facebook-like distractions and ads, since advertising is their ballywick.

If you are interested in learning more, let me know and I'll invite you to my Circle.

Wednesday, March 16, 2011

NY Times: Japan Interactive Earthquake Map

The New York Times' Interactive Map of the Damage from the Earthquake in Japan:

http://www.nytimes.com/packages/flash/newsgraphics/2011/0311-japan-earthquake-map/index.html?hp


I was able to locate the town where my friend Pia's brother is teaching English (center of quake zone but far from the nuclear plants, very little structural damage, no casualties) and where my daughter's camp friend's family lives (quite a bit south of Tokyo, out of quake zone).

Coincidentally enough, Brett and I were attending a New York Red Cross breakfast the morning the tsunami was announced, and while the content of the morning's presentation was focused on what the Red Cross does for New Yorkers, it certainly added some urgency to the obligatory donation appeal at the end of the breakfast. (Brett is a volunteer photographer for the Red Cross and my friend Sonia's husband, Nick Malik, sits on the NYC board).

On a cheerier note, a friend pointed me to this T-shirt on Treadless.com combining Eisenlohr's projection with an image of a radio broadcast signal. This is an entry for Oceanic Preservation Society T-shirt Challenge. Theme: Singing Planet. Really neat design.


http://atrium.threadless.com/singingplanet/submission/1009/

Monday, July 19, 2010

Notes on Geospatial Summit 2010

Steve Romalewski posted notes on NYC GIS Summit 2010 at:

http://spatialityblog.com/2010/05/24/notes-from-nysgissummit2010/

Feel free to post any comments, different opinions, more detailed feedback if you attended.

Also check out Steve's post about a new feature in Google Maps – the ability to modify the cartographic styles used in Google’s basemap. He's interested in thoughts about how this might impact online cartography.

http://spatialityblog.com/2010/05/21/thoughts-about-google-map-styles/

Tuesday, November 10, 2009

Be a GeoMentor!

Amy Jeu sent me this announcement. If you love mapping and love mentoring kids, don't miss this opportunity:

The Geographic Information Sciences (GIS) software company ESRI has partnered with National Geographic to recruit GIS professionals to mentor students. In true GIS form, they present a map of who is mentoring where. So far, no one has volunteered in NYC (as of Nov. 5). Participation is a great way to kick off GIS Day, which is November 18, just a few days away. Also, see details on Geography Awareness Week, which begins next week.

Please use the http://www.geomentor.org/ website to sign up for the GeoMentor program.

Thursday, February 10, 2005

CITI Advanced Training

We will be scheduling a CITI training for CBs and CBOs in Brooklyn this spring. The date is dependent upon the number of participants. Training will include basic GIS principles, GIS desktop software and tips for making your own maps. Contact us at citi@mas.org if you would like to participiate.

Additional information about the CITI Youth program and how to find rezoning areas can be found in the March issue of the CITI Newsletter at http://www.myciti.org/newsletters/2005-03.html.

GoogleMaps

Discussion of GoogleMaps has been lively on my User Interface design lists. Overall ratings for Google Maps are good, but I have problems with the way they locate places based on search.

GoogleMaps
http://maps.google.com/
Posters say they like that you can drag the map and that the directions appear to be more accurate than MapQuest or Yahoo! Maps. To find places on the map, you can use their search boxes on the right or enter a search in the bar above. It wasn't apparent at first exactly how to find groups of things like hotels or grocery stores, which is organized as a layer on Yahoo (click a box marked restaurants). I had to take the Tour to figure that the search bar is the way to do this. Using the search bar you can plot places like restaurants, hotels, etc. based on info on web pages they have stored, which is sort of wild but not always accurate or complete. I prefer Yahoo!'s ability to plot items that are categorized as what they are vs having the word in its name, e.g., if you search for "Farm" you get a lot of State Farm agents.

But one thing Google does well is to tie a particular location to its "more like this" search function. If you click a search result, it will point you to the website of the entity in question or a list of websites of nearby related entities. This is less seeing it on a map than finding what may be nearby. Unfortunately, if you try to use the back button to return to the map search results, you get the default GoogleMaps view.

As for the interface, I had a tendency to reset the map back to the entire US view by accident, while using the zoom function. The Zoom and Reset buttons are a bit close and not otherwise labeled. Reset button looks a lot like "Recenter" to me. Also, if you pan off of the US and try to zoom in, you get a lot of blank images with red Xs. And don't try to find South America, Europe or Russia. The oceans go on forever....

Here are a some similar maps in other parts of the world:

Search.ch Map (Switzerland)
http://map.search.ch/
A blogger recently suggested that Google copied the interface from this site. It uses an aerial photo layer that is fun to zoom into, but probably not entirely necessary for the purpose of the site.

Map My India
http://mapmyindia.com/

from a post on sigia-l:

Although the quality, accuracy and detail [of mapmyindia] isn't comparable but at least in some respects such as download speed and ease of marking major landmarks, it's actually better than Google Maps and Mapquest.

To see how it works, search for Juhu, Mumbai, Maharashtra. You can plot hotels, banks, ATMs etc on the map using the menu on right. One cannot however, link to a particular location without subscription.

The design of the site is led by a 19 years old Stanford sophomore,
Rohan Verma. http://nripulse.com/Archives/Profile_Rohan.htm

Maps Aid Community Decision-Making

February 9, 2005, Municipal Art Society

CITI map technicians Earl Dunn and Marcus Sheftall from Bushwick’s Academy of Urban Planning are becoming celebrities at their local community board meetings. At each meeting of Community Board 4 and its land use committee, the10th graders project large maps on a screen by accessing www.myciti.org with a wireless laptop.

Following the meeting’s agenda, students zoom into areas and properties being discussed and answer questions from board members about local zoning, property ownership and other planning related issues.

Map Technicians at Brooklyn CB4 Map Technicians at Brooklyn CB4 Marcus Sheftall and Earl Dunn compare a rendering of a proposed new firehouse design for their community with its building footprint and surrounding land uses.

Earl and Marcus were chosen after a month-long application process that included applications, map-making, resumes, cover letters, and interviews Nadine Whitted, District Manager at CB4. “Once they told me I got the job I was very excited, being that it’s my first job,” Marcus says. “Then when I found out that a friend of mine Earl Dunn was employed also, it helped because at least I would know someone else there. We went through training for two weeks, which was fun because I learned a lot.”

The training program for the students and their teachers was designed by the Municipal Art Society Planning Center and the Brooklyn Center for the Urban Environment, lead partner at the Academy of Urban Planning (AUP), a New Visions school.

“The students really look forward to coming to the meetings and see that they are making a valuable contribution to discussions,” says Meredith Phillips, Urban Planning Coordinator at AUP who has integrated the program into the school’s theme-based activities. “They are learning a lot about community participation – and having a great time in the process!”

After the last CB 4 meeting in January, several members of the board came over and marveled as the students created and queried the maps for information. Even NYPD officers asked for maps to use as reference for their work in the area.

How to Get Involved

The CITI Youth program is expanding into new high schools and community boards next fall and has only 4 spots left for new host schools. If you are a community board member or educator that would like to find out more about the CITI Youth program contact citi@mas.org.

Municipal Art Society
Community Information Technology Initiative
http://www.myciti.org

Thursday, July 08, 2004

Happy Birthday, STOP Sign

I love finding crossroads where my interests in usability and mapping meet. In Happy Birthday Stop Sign, Eric Reiss discusses the birth and standardization of the ubiquitous stop sign.

Thursday, May 20, 2004

GISMO blog

I am working on a new design for the GISMO (NYC area GIS user group) website and am experimenting with adding a blog.

Please take a look:

http://gismonyc.blogspot.com

This blog is hosted on blogspot.com. It is rather featureless at this point, but I think as an example of what a blog would look like for a group like ours, it is a start. I plan to move it to MovableType when I set up a new hosting account. I've decided to drop Brinkster & go to Netfirms. I took a class at eclasses.org in blogging and really love the MovableType interface.